–leaving families with far more to spend and invest
BETWEEN 2015 and 2019, households in Guyana saw nearly 30.1 percent of their household income consumed by VAT and fees under the APNU+AFC government’s policy of expanding VAT to over 200 goods and services.
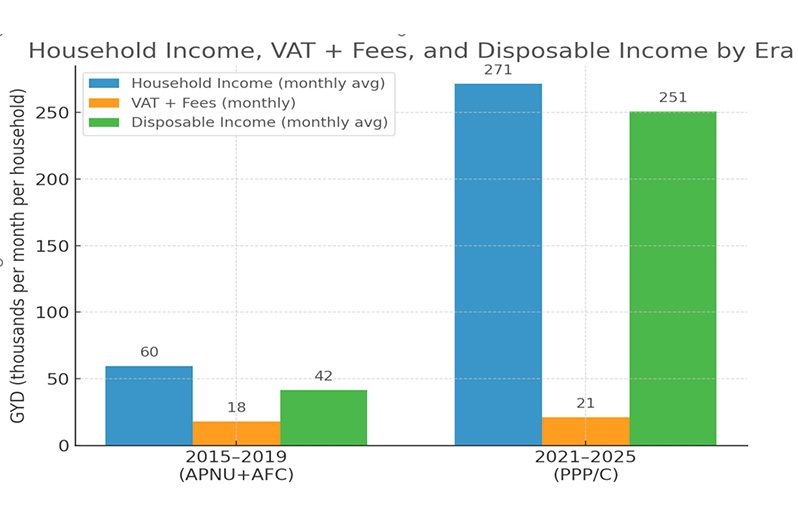
From 2021 to 2025, under the PPP/C government, the relative tax bite fell to just 9.34 percent of household income, even as total VAT collections remained high. As a result, average monthly disposable income per household jumped from GYD 41,632 to GYD 250,591—a sixfold increase.
2015–2019: THE APNU+AFC VAT EXPANSION
The APNU+AFC government expanded VAT coverage to more than 200 previously exempt goods and services. Average monthly household income was about GYD 59,618, while VAT and fees averaged GYD17,933 per month—representing roughly 30.1% of income.
This left households with an average disposable income of GYD 41,632 per month, limiting growth in consumption and investment at the household level. At roughly GYD 60,000 per month in 2015–2019, a typical family saw around GYD 18,000 go to VAT and other fees—before rent, utilities, or groceries.
2021–2025: THE PPP/C REVERSAL AND INCOME SURGE
Under the PPP/C, VAT on many goods and services was rolled back, lowering the relative tax burden sharply.
Average monthly household income surged to GYD 271,425, with VAT and fees averaging just GYD 21,183 per month—only 9.34 percent of income.
This allowed disposable income to soar to GYD 250,591 per month, enabling households to spend, save, and invest at levels not seen in the previous era.
CONCLUSION
Tax policy is not just about percentages—it’s about what families keep. The APNU+AFC years show that expanding the tax base without matching income growth erodes disposable income.
The PPP/C years demonstrate that a lighter tax bite, paired with strong income growth from wages, welfare, and subsidies, can deliver robust tax revenues and far higher take‑home pay.
For households, that difference is tangible: more money left after taxes—month after month. One government took a bigger slice of a smaller pie; the other grew the pie and took a smaller slice.
METHODOLOGY & DATA SOURCE
This analysis uses total national household income (in GYD millions) and the number of households (in thousands) to derive per-household income. VAT and fees per household are taken from national budget estimates. Relative tax burden is calculated as VAT + fees divided by total household income.
All figures are converted to per-household monthly values for comparability. Era averages are based on full terms only: 2015–2019 (APNU+AFC) and 2021–2025 (PPP/C). Transition years are excluded to ensure a fair comparison between complete administrations.
Data for 2015–2024 are actual figures based on budget estimates, while 2025 figures are projections based on the Budget 2025 estimates.
The wages component of household income only captures wages within the income tax bracket; it does not include wages under the income tax threshold or informal income. Sources: Budget Estimates 2015–2024; Budget 2025 (projected).
Notes
Calculation notes: Burden % = (VAT and other fees per household ÷ annual income per household). Example (PPP/C average): 21,183 × 12 ÷ 271,425 × 12 ≈ 9.34%.


.jpg)


