


.png)


A Contextual Analysis of the Public Sector Wage Increase
Summary
* TYPICALLY, salary increases are incremental and is usually treated as a cost-of-living increase.
* The call for a 20 per cent increase cannot be accommodated simply because total employment cost of above 30 per cent and in this case above 50 per cent is not financially and fiscally sustainable.
* The notion of a 20 per cent wage increase for public servants could potentially result in 25 per cent inflation which would have effectively diminished the purchasing power of the currency by 25 per cent.
* The private sector deposits in the banking sector to current revenue ratio is for the period 2007-2017 averaged1.72 or 172 per cent, which means for every dollar of taxes paid by the private sector, private sector firms had 1.72 or close to $2 remaining. While, for the period 2014-2019, this ratio averaged the lowest of 137 per cent, which means for every dollar of taxes paid by firms, they had $1.3 remaining, less than the $2 dollar in the period that experienced horizontal growth versus vertical growth.
* The revenues earned from the oil resource ought not to be treated as the traditional, organic revenue of the state.
* It should be appreciated that the reality is of such that–to pay better wages to public servants and to increase the overall wealth of the country– it is critical to focus on private sector development, continue to incentivise the private sector and to attract new investments, both local and foreign direct investments (FDIs).
* In so doing, the organic revenue of the government will grow in a more broad-based and sustainable manner (horizontal growth). Any other approach to growth (vertical growth) other than that which is the current philosophy, will be a recipe for bankruptcy and economic devastation in the long-term, not only for public servants, but for every household and private enterprise.
* The analyses presented herein provide sufficient empirical evidence to support this view.
BACKGROUND
On the 18th November, 2021, the Government of Guyana announced the anxiously awaited wage increase for public servants. The wage increase at this time is seven per cent retroactive for the fiscal year 2021. Soon after the announcement was made, the government received harsh criticisms from members within the political opposition and other commentators alike.
DISCUSSION AND ANALYSIS
Typically, salary increases are incremental and is usually treated as a cost-of-living increase, which should be just above the rate of inflation. This is primarily to help cushion the impact of cost-of-living increases. Moreover, an incremental increase or cost-of-living increase should not be confused with a revision/increase in the salary scale or a promotion – both of which would result in the individual seeing a more tangible increase in their take-home pay.
Shortly after the announcement was made, the Hon Minister of Parliamentary Affairs and Governance revealed that in the 2022 budget, provisions will be made to correct a number of anomalies regarding wages and salaries paid in the public service. To this end, the minister explained that there are some employees who hold a first degree, for example, and are paid $190k in one agency while another person with similar credentials earns $120k in another agency. According to the minister, there are many such anomalies within the system which will be remedied in budget 2022.
It is worthwhile to note that in remedying the above anomalies, which is a good move on the part of the government, would ultimately result in a relatively large number of public servants receiving more tangible increases in their net salaries in 2022.
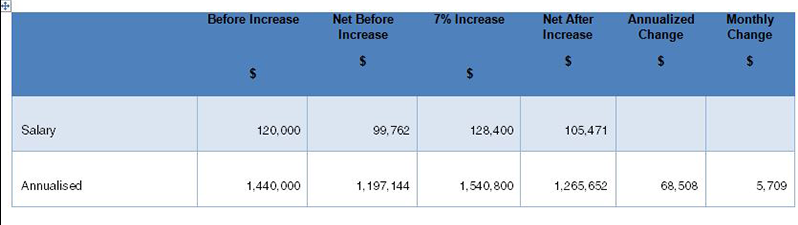
Salary Increase Example: Seven per cent Incremental Increase and Salary Scale Adjustment Expected in Budget 2022
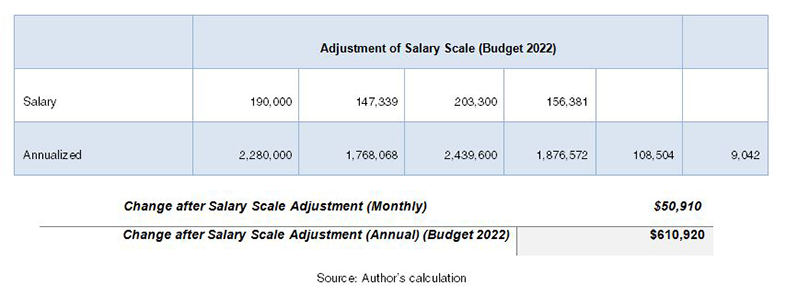
Change after Salary Scale Adjustment (Monthly) $50,910 Change after Salary Scale Adjustment (Annual) (Budget 2022) $610,920
Source: Author’s calculation
In the given example illustrated above, a person earning $120k gross salary would take home $105,471 monthly, representing an increase of approximately $6k monthly from $99,762 before the seven per cent increase, and when annualised, amounting to approximately $68,508 more in disposable income. This annualised sum is sufficient to cover at least one month’s grocery bill for an average low-income family of two-three persons or transportation cost, assuming one incurs $1k a day in transportation, on average, or even utility bills. These are examples of cost-of-living expenses which the incremental increase is intended to help cushion.
In the same example above, which is more or less a real example given by the Hon Minister, should the employee who earns a gross of $120k benefit from an upward adjustment in salary scale to $190k, the employee will be taking home a net of $156,381, representing a monthly increase of approximately $51k or 49 per cent. In this case, when annualised, the employee who previously earned a net salary of $105k, will be taking home approximately $612k more in disposable income for the year. This sum can supply at least 10 months groceries for the average household or can be invested otherwise in any entrepreneurial endeavour, or to help secure the down payment for a new home for an average low–to moderate-income household. Hence, in this example, the remedying of the salary scale upward would ultimately result in the employee benefiting from a more tangible increase in disposable income.
It should be mentioned, too, that public servants also enjoy a number of other benefits such as:
I. Vacation allowance
II. Duty allowance
III. Responsibility allowance
IV. Acting allowance
V. House allowance
VI. Meal allowances for specific categories of employees
VII. Duty free allowance for specific categories of employees
VIII. Uniform allowance for specific categories of employees
IX. Telephone allowance for specific categories of employees
X. Entertainment allowance for specific categories of employees
XI. Scholarships
Public Servants Total Employment Cost per cent of Current Revenue
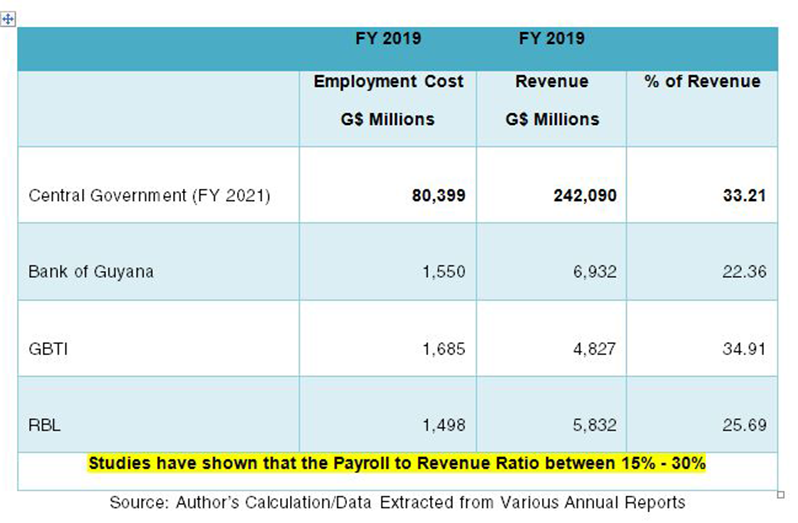 Studies have shown that the Payroll to Revenue Ratio between 15% – 30% Source: Author’s Calculation/Data Extracted from Various Annual Reports
In order to ascertain whether an organisation or a government pays its employees a decent wage, one has to examine this question from a realistic, practical, and financially sustainable standpoint. To do so, one has to look at the total employment cost as a percentage of revenue. Generally, there is a universal benchmark for this ratio in keeping with financial management best practices and that is: total employment cost should be in the region of 15 per cent-30 per cent of revenue. There are studies to substantiate this in the corporate world globally.
In the illustrations above, total employment cost for the Bank of Guyana represents 22.36 per cent of the bank’s revenue, in the case of GBTI, total employment cost represents 35 per cent, Republic Bank, total employment cost represents 26 per cent even though Republic Bank raked in almost $1 billion more in revenue compared to its main competitor; GBTI, and, in the case of the public service, total employment cost represents 33.21 per cent of central government’s current revenue.
Public Servants Wage per cent of Current Revenue: Comparison between Guyana and Trinidad & Tobago
Source: Author’s Calculation/Data Extracted from Central Banks’ Reports of the Respective Countries
Moreover, in comparing total employment cost relative to current revenue for Guyana and Trinidad & Tobago, it was found that for the period spanning 2011–2021 (10 years), total employment cost for Guyana in 2011 represented 26 per cent of current revenue which increased to 33.21 per cent in 2021. While in the case of Trinidad & Tobago (which is a more mature petroleum-producing country though now in a declining stage), and a country considered to be the most developed economy in the Caribbean, and in fact four times richer than Guyana in terms of GDP and per capita income, in 2011 total employment cost represented 15 per cent of current revenue which grew to reach 27 per cent by 2020– remaining below that of Guyana.
Within this perspective, it can be said that in the years when the Trinidad economy was doing much better on the back of its oil and gas resources, Guyana allocated more resources than Trinidad to pay public servants and it continues to do so above Trinidad in 2020–relative to the country’s level of current revenue.
Therefore, with these two examples, it can be said that public servants in Guyana are compensated decently, when compared to other organisations in Guyana, its regional counterpart, and benchmarked against financial management best practices globally. In other words, if total employment cost for the public sector represented just 15 per cent or less of current revenue, then this can be described as poor.
However, where employment cost represents 30 per cent or even slightly above, this is in line with the highest-paid wages organisations and governments can afford to pay its employees relative to the revenues generated.
Comparing the Size of the Public Sector Relative to the Population
Looking at the size of the Public Service relative to population for a few countries. In Guyana, the public service represents approximately 8.13 per cent of the population and about 12 per cent of the labour force. In Trinidad & Tobago, the Public Service represents about 10 per cent of the population and in Canada 0.72 per cent of the population.
(To be continued)