


.png)


MORE than a quarter of the diseases suffered by humans is as a result of environmental hazards. Among these diseases are diarrhoea, respiratory infections and malaria, which are more prevalent in the developing world. Environmental hazards also result in numerous forms of unintentional injuries.
![]() The field of environmental health assesses and controls the environmental factors that can potentially affect our health. It is targeted towards preventing disease and creating environments that will provide for a healthy population. Worldwide, it is estimated that as many as 13 million deaths could be prevented every year by making our environments healthier.
The field of environmental health assesses and controls the environmental factors that can potentially affect our health. It is targeted towards preventing disease and creating environments that will provide for a healthy population. Worldwide, it is estimated that as many as 13 million deaths could be prevented every year by making our environments healthier.
Understanding Environmental Health
The main elements of the environment that affect our health are:
• Outdoor Air Quality
Poor air quality is linked to premature death, cancer, and long- term damage to respiratory and cardiovascular systems. Air quality can be degraded by emissions from factories, vehicles, etc. Decreasing air pollution is an important step in creating a healthy environment. Practices such as carpooling and travelling via public transportation, riding or walking short distances, and using locally produced goods can go a far way to maintaining good outdoor air quality.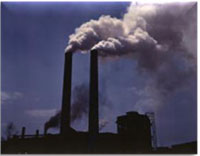 • Surface and Ground Water
Surface and ground water quality applies to both drinking water and recreational waters. Contamination by infectious agents or chemicals can cause mild to severe illness. Protecting water sources and minimizing exposure to contaminated water sources are important parts of environmental health.
Water quality is an important global challenge. Diseases can be reduced by improving water quality and sanitation and increasing access to adequate water and sanitation facilities. Proper disposal of our wastes can go a far way in ensuring we have a safe water supply.
• Toxic Substances and Hazardous Wastes 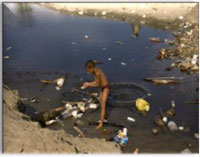
Toxic substances such as lead, chemicals, pesticides, etc. have a great effect on our health. Exposure to toxic substances can be acute (short term) or chronic (long term). Short term exposure to toxic substances can cause rashes or skin irritation, headache, nausea, or burns. A remedy can be easily found for these effects. Chronic exposure on the other hand, would lead to more severe implications for our health. Our immune systems can be damaged, leaving us predisposed to many diseases. Key organs such as our liver and kidney are also damaged and persons can also suffer from cancer. Reducing exposure to toxic substances and hazardous wastes is very important to environmental health.
• Homes and Communities
People spend most of their time at home, work, or school. Maintaining healthy homes and communities is also essential to environmental health.
Some of these environments may expose people to:
• Indoor air pollution
• Inadequate sanitation
• Electrical and fire hazards
• Lead-based paint hazards
Since the quality of our environment has an impact on our health, we therefore need to strive to do our part in maintaining our surroundings.
Kids Activity
In this activity, you will investigate air quality in different areas.
Instructions
What you will need:
• white card
• scissors
• vaseline
• tape, drawing pins
• microscope
What to do
1. Cut out several 5 cm x 5 cm squares of white card.
2. Smear the surface of each with Vaseline
3. Fix the squares to as many different areas you can think of, for example, by the bus stop, inside the classroom, under trees, by a car park, on a post by traffic lights, on your back door and so on. Leave for 24 hours. (As an alternative, you could use slightly damp cotton wool to swab different surfaces, such as road signs, leaves on trees, window panes, and so on.)
4. The squares will now have tiny particles stuck to them making them grey. Most particles will be too small to see – try looking at them under the microscope.
5. Devise a particle pollution indicator for your cards based on the results you get (see below for an example). It is best to have about five categories.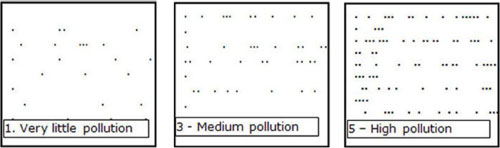
6. Score each card on how polluted it is.
7. Use this data to draw a graph showing the level of air pollution in the various areas.
8. Can you make any statements about your graphs? What areas were least polluted? What areas were most polluted? Are there any links between the areas that are most polluted?
You can share your ideas and questions by sending letters to: “Our Earth, Our Environment”, C/O EIT Division, Environmental Protection Agency, Ganges Street, Sophia, GEORGETOWN or email us at eit.epaguyana@gmail.com