By Joel Bhagwandin, Financial Analyst
IN 1992, when the PPP/C administration assumed the reins of government as a democratically elected government, for first time since post-independence history, the economy inherited was in a bankrupt state.
The Ramprakash study in 1991 (cited by the World Bank) calculated that if receiving official nutritional requirements was the underlying criterion, an estimated 86% of the population would fall under the poverty line.
Suffice it to state, aside from the World Bank’s poverty line benchmark based on income, another more broad-based empirical measure to determine whether poverty in Guyana has been increasing or decreasing, would be to empirically estimate and measure households “Net Wealth” (NW).
Such an empirical analysis (utilizing financial sector data and income tax data to compute the estimated net household income for the period 1990-2023) was recently performed by this author. Towards this end, over the last three decades, households NW increased by 61x since 1990 to reach an estimated $500 Billion in 2023, representing 13% of GDP (40% of non-oil GDP). For the same period (1990-2023), overall GDP grew by 249x, reflecting a slower pace of growth in contrast to household income which grew by 303x, thereby outpacing the rate of growth in overall GDP.
 More than 500,000 persons have benefited directly from the budgetary allocations made in the social services sectors, agriculture and tourism sectors combined.
This includes access to new agricultural lands, drainage and irrigation, farm to market access roads, loans and grants, training and development, licenses, new products in the tourism industry, housing and water, and certifications among others. Moreover, the investments in the infrastructure sector enhances asset/property values, contribute to cost efficiency and savings, while aiding the creation of new opportunities and industries.
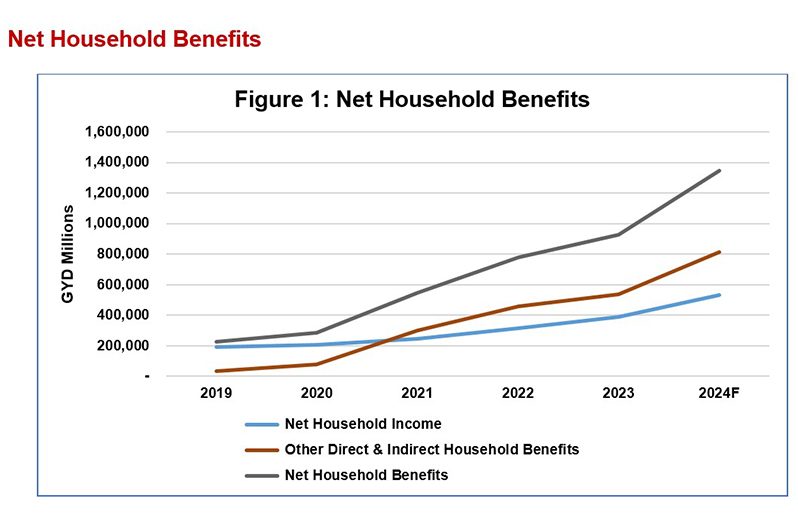
In order to determine whether the PPP/C’s Government economic policies and budgetary allocation in key sectors, social services sectors included, are positively impacting the population, an analysis of the net benefits per household would be a good indicator in this regard.
In so doing, it was found that (using 2019 as the base year) while GDP has nearly quadrupled; net household income is estimated to triple by the end of 2024, other direct and indirect household benefits are estimated to increase twenty-fivefold by the end of 2024; and altogether, net household benefits are estimated to increase six-fold since 2019, by the end of 2024, from $226 Billion to an estimated $1.35 Trillion or from $0.941 Million per household to an estimated $5.6 Million per household (annually).
Evidently, the economic policies pursued by the government and the investments deployed in the economy are yielding the desired positive impact at the household level.


.jpg)


