

.jpg)


By Joel Bhagwandin
SUMMARY
BUDGET 2024 under the theme, “Staying the course: Building prosperity for all,” is consistent with the journey of development that the PPP/C administration commenced since 1992. Towards this end, over the last three decades, household incomes have grown by 303x since 1990 to reach $241 billion in 2023, representing 9.3 per cent of GDP (19.5 per cent of non-oil GDP); household savings have grown by 54x to reach $364 billion in 2023, representing 4.5 per cent of GDP (29.4 per cent of non-oil GDP); household debts have grown by 154x to reach $176 billion, representing 4.5 per cent of GDP (14.2 per cent of non-oil GDP); while households’ Net Wealth increased by 61x since 1990 to reach $439 billion in 2023, representing 11.2 per cent of GDP (35.5% of non-oil GDP).
Notably, total households’ net wealth was greater than the net assets for business enterprises (1.42x) which is an estimated $309 billion at the end of 2023. However, households’ net income represents 84.2 per cent of business enterprises net profits for 2023. Interestingly, for the same period (1990-2023) overall GDP grew by 249x, reflecting a slower pace of growth in contrast to household income which grew by 303x, thereby outpacing the rate of growth in overall GDP.
INTRODUCTION
On January 15, 2024, the national budget for the fiscal year 2024 was presented by Senior Minister with responsibility for Finance within the Office of the President, Dr. Ashni Singh, to the National Assembly. The budget is 46 per cent larger over budget 2023, amounting to $1.15 trillion, reflecting a 38 per cent increase over the actual expenditure for FY 2023.
The budget was presented under the theme: “Staying the course: Building prosperity for all.” While the budget is certainly the largest in absolute terms, it is among the smallest in three decades in relative terms―that is, relative to GDP. In 1992, the budget represented 59 per cent of the GDP, which subsided consistently year over year (Y o Y) since then to reach 21 per cent in 2014, up marginally to 27 per cent in 2019, then down to 21 per cent in 2023 and 23 per cent of GDP for 2024, based on the growth forecast for this year.
This is an especially important indicator in respect of fiscal sustainability over the medium to long term, aside from the fact that the debt-to-GDP ratio (2024F) remains in the record low-level region, which is projected to remain below 30 per cent.
Considering the country’s development needs, not only in infrastructure, but in every other sector such as health, education, climate adaptation and resilience, public safety and security, information technology, improving the ease of doing business, public administration, the economic sectors, regional development, etc., the earnings derived from the oil and gas sector are inadequate.
While at the same time, it is imperative for the government to accelerate the development and economic transformation agenda, not only for the present, but also for future generations.
Critics of the government disputed the theme of the budget, albeit without any robust empirical analysis.
The analysis and discussion herein sought to address this aspect, which is framed within the context of the PPP/C government’s assuming the reins of government since 1992. Historically, the PPP/C government inherited a bankrupt economy, wherein the debt-to-GDP ratio was 900 per cent, the inflation rate was 87 per cent, interest rates were hovering over 30 per cent, the poverty level was nearly 90 per cent of the population, there was no foreign exchange reserves at the central bank, the debt service to revenue ratio was over 150 per cent, and zero savings in the bank.
Shortly after assuming office in 1992, the PPP/C government crafted a National Development Strategy (NDS1996), which was incrementally implemented year after year since 1997. Despite the many economic, social, and political challenges during that period of the country’s history, the PPP/C government has been staying the course of development and building prosperity since then, as demonstrated hereunder.
METHODOLOGY AND ASSUMPTIONS
Measuring and estimating household Net wealth. The author examined the level of growth in individual/household wealth for the years 1990–2023. In doing so, the author considered the total deposits (Individual financial assets) and total loans and advances including real estate mortgages for individuals in the financial sector.
This data was used to calculate the Net Wealth (NW) for households, where NW = Real Assets (RA) + Financial Assets (FA) – Total Liabilities (short- and long-term loans and advances). Real assets are physical assets (fixed or non-current assets) such as property. The loans and advances portfolio are typically collateralised―that is, backed by tangible non-current assets (individual properties).
In the calculations, a Loan-to-Value (LVR) ratio of 70 per cent was considered, given that the financial institutions typically do not lend beyond 70 per cent of the market value of the pledged collateral. Accordingly, these assumptions were taken into account to estimate the market value of the real assets for households. All of the estimates derived are based on conservative assumptions.
Measuring and estimating private sector income. The disaggregated data on tax collection by the State is publicly available in the National Budget Estimates. Therefore, it is possible to mathematically calculate the national income for individuals by solving a mathematical equation with the two known variables (variable (1) taxes collected and variable (2) the tax rates), to find the unknown value for (X) representing individual income before and after tax.
An average individual income tax rate of 30 per cent for the period 1990-2017 was applied, and an effective individual income tax rate of 23 per cent to calculate the income for the period 2018-2023, was applied. For the business enterprises, the author used the average of the three corporate tax rates (45 per cent, 40 per cent and 25 per cent) giving rise to an average corporate tax rate of 37 per cent to calculate the profit before and after tax for companies.
In the estimation of the gross revenue, on the basis of publicly available financial information for publicly traded companies coupled with SphereX database of clients, operating profit margin before tax ranged between 10-25 per cent. The average of this range was used to calculate the gross revenue for companies by forming a mathematical equation with the other variables previously mentioned.
MAIN LIMITATIONS
There are two main limitations. First, it must be borne in mind that the results of the analysis conducted are conservative given that individuals do not necessarily pledge all of their assets as collateral. So, the Net Wealth derived would be an understated reflection of the true, real value.
Second, the unbanked population in the 1990s versus over the last 15 years, would have improved with the wide network of bank branches covering significant geographic spread across the ten administrative regions over the last three decades, and further aided by the financial inclusion policy adopted by the financial regulator. In this respect, based on the author’s estimate, the unbanked population in the 1990s is an estimated 70 per cent, which is estimated to have declined to 25 per cent or less in the current environment.
The increased income tax threshold over the years, which would effectively exclude low-income earners from the income tax bracket, this segment of the labour force population represent an estimated 20 per cent of the total labour force population. At the current average market rates for the low-income segment of the labour force, the estimated annual aggregate income is in the region of $60 billion annually (based on the author’s estimate). The total income for this category is excluded from the analysis.
HOUSEHOLD INCOME, SAVINGS, DEBT AND NET WEALTH
Households net income grew from $795 million in 1990 to $241 billion in 2023, reflecting an increase of 30.197 per cent or 303x over this period; savings grew from a position of $6.7 billion in 1990 to $363.5 billion in 2023, reflecting an increase of 5,315 per cent or 54x over this period; debt grew from $1.14 billion in 1990 to $176 billion in 2023, reflecting an increase of 15,297 per cent increase or 154x over this period; while households net wealth increased from $7.2 billion in 1990 to $439 billion in 2023, reflecting an increase of 5,994 per cent or 61x over this period (Chart 1).
In 1990, household savings, debt, income, and net wealth represented 43 per cent, 7.3 per cent, 5.1 per cent and 46 per cent of GDP respectively. In 2023, household savings, debt, income, and net wealth represented 9.3 per cent, 4.5 per cent, 6.2 per cent and 11.2 per cent respectively (Chart 2 (a)). However, as a share of non-oil GDP, household savings, debt, income, and net wealth represented 29.4 per cent, 14.2 per cent, 19.5 per cent and 35.5 per cent respectively at the end of 2023 (Chart 2 (b)).
 Source: Author/Budget Estimates, Various Years, Bank of Guyana Statistical Bulletin, Various Years

Source: Author/Budget Estimates, Various Years, Bank of Guyana Statistical Bulletin, Various Years
.

Source: Author/Budget Estimates, Various Years, Bank of Guyana Statistical Bulletin, Various Years
For the same period, GDP grew from $15.6 billion in 1990 to $3.9 trillion at the end of 2023, reflecting an increase of 24,845% or 249x; while non-oil GDP grew 7795% or 79x to reach $1.24 trillion at the end of 2023.
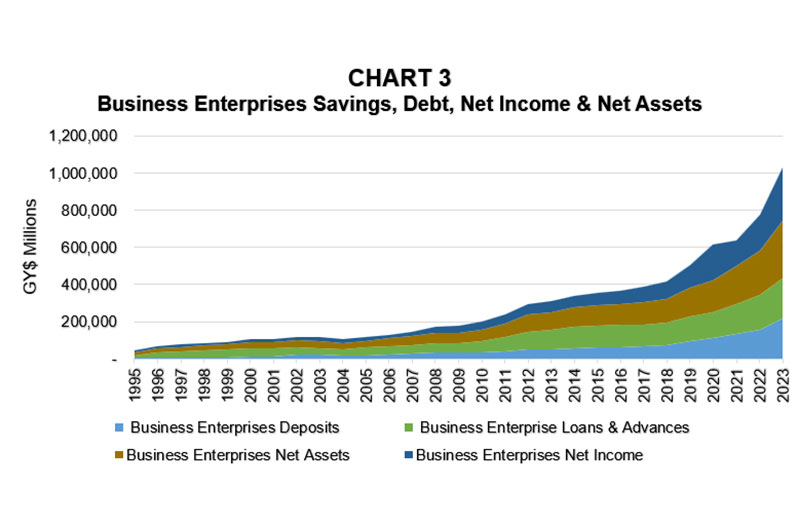
BUSINESS ENTERPRISES NET INCOME, SAVINGS,DEBT AND NET ASSET
Source: Author/Budget Estimates, Various Years, Bank of Guyana Statistical Bulletin, Various Years
Business enterprises savings in the banking sector grew from $4.8 billion in 1995 to $216 billion in 2023, reflecting an increase of 4,403 per cent or 45x; debt increased from $15.8 billion to $216 billion in 2023, reflecting an increase of 1,261 per cent or 14x; net profit increased from an estimated $11.6 billion in 1995 to an estimated $286 billion in 2023; while net assets increased by an estimated $11.6 billion in 1995 to $309 billion in 2023, reflecting an increase of 2,561 per cent or 27x (Chart 3). In 1995, business enterprises savings, debt, net assets, and net income represented 5.4 per cent, 18 per cent, 13.2 per cent, and 13.2 per cent of GDP respectively. In 2023, these indicators represented 5.5 per cent, 5.5 per cent, 7.9 per cent and 7.3 per cent of GDP respectively (Chart 4).

Source: Author/Budget Estimates, Various Years, Bank of Guyana Statistical Bulletin, Various Years
CONCLUSION
Altogether, budget 2024 under the theme, “Staying the course: Building prosperity for all,” is consistent with the journey of development that the PPP/C administration commenced since 1992.
While the budget is touted as the largest in absolute terms, it is among the smallest relative to GDP since 1992-2005, representing 23 per cent of GDP. Hence, Budget 2024 is not an extraordinarily large budget. The macroeconomic framework within which the budget is crafted is among the few countries with some of the strongest indicators within the context of the global economy.
Furthermore, over the last three decades under the economic stewardship of the incumbent administration, households’ wealth has grown considerably, outpacing the rate of growth in overall GDP, thereby signalling the positive outcomes of the government’s economic policies and investment in the economy.