(ESPNCRICINFO) – New Zealand have been a force to be reckoned with in Test cricket over the last few years – the fact that they top the Test rankings is proof of that – but go back just a little farther and the numbers tell a completely different story.
In fact, splitting the last 14 years equally into two – from 2007 to 2013, and then from 2014 onwards – reveals just how dramatic the improvement has been. The number of matches played in both periods is almost the same – 57 versus 59 – but in the second period New Zealand have won more than two and a half times the number of Tests they won between 2007 and 2013.
In that seven-year period between January 2007 and December 2013, New Zealand won 12 out of 57 Tests, and lost 27. Their win-loss ratio of 0.444 was poorer than all teams except Zimbabwe, West Indies and Bangladesh. From those lows they have come a long way in the last seven and a half years with a 32-17 win-loss record – their ratio of 1.882 is better than all teams except India.
That seven-year period from 2007 began with Stephen Fleming relinquishing captaincy, after having led New Zealand in 80 Tests; only two captains anywhere – Graeme Smith and Allan Border – have had longer stints as captains. Daniel Vettori took over from Fleming, but that transition didn’t work too well, as New Zealand were thrashed in two Tests in South Africa, and then lost home and away to England. In the 32 Tests in which Vettori led New Zealand, they won only six and lost 16.
Those were dark days for New Zealand cricket but their rise in recent years has been remarkable, and built largely upon an outstanding home record (though the series win in England this month indicates how competitive they have become overseas too).
In the period between 2007 and 2013, they only had a 8-8 win-loss record at home; since then they have become super-dominant at home, with 22 wins and only three defeats. Among teams that have played at least ten home Tests in this period, only India have a better win-loss ratio.
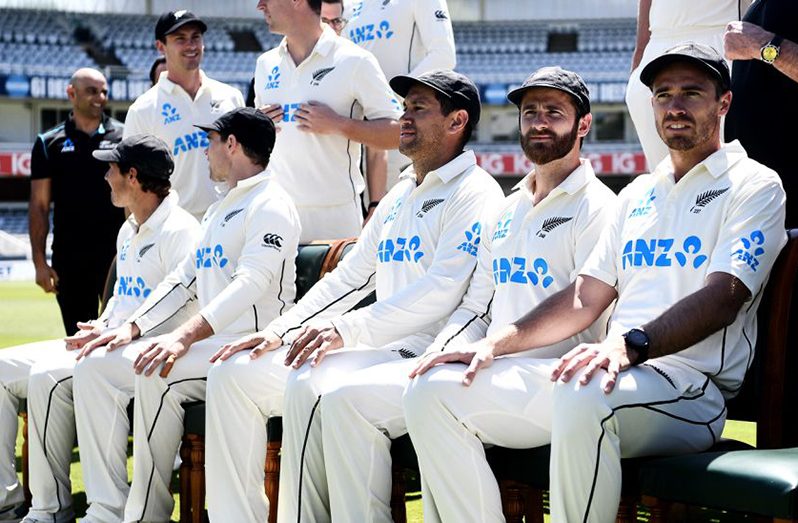
One of the standout features of this team is the experience, and the settled core of the side. In New Zealand’s Test history, only 14 players have appeared in more than 70 Tests, of which five are in the current set-up: Ross Taylor, Kane Williamson, Tim Southee, BJ Watling and Trent Boult – two batters, two bowlers, and a wicketkeeper, which ensures all bases are covered. Add Tom Latham (58) and Neil Wagner (53) to the list and New Zealand have a solid core of seven players who have played 50-plus Tests.
In fact, the top five most experienced line-ups that New Zealand have ever put out on the park – in terms of Test caps for the playing XI – have all come in the last 19 months. The most experienced team was in the Boxing Day Test against Pakistan last year, when the total appearances for the playing XI added up to 572 matches. Apart from the seven mentioned above, the side included Tom Blundell, Henry Nicholls, Mitchell Santner and Kyle Jamieson.
In the second Test on India’s tour to New Zealand last year, the total experience of the playing XI added up to 545 Tests; the only change from the team that played Pakistan was Colin de Grandhomme in for Santner. And the XI that played at Lord’s in the recently concluded series in England had a collective experience of 535 matches, which is fourth on their all-time list.
Since the start of 2014, New Zealand have called upon only 35 players to play 59 Tests. That means only 24 players have been called up in addition to the 11 who played in the first of those matches. That works out to a rate of 2.42 Tests per new player being called up. No team has had such a stable pool of players during this period. The next best are India, who used 45 players for 74 Tests, a rate of 2.15 Tests per new player.
In the period between 2007 and 2013, 49 players were called up for the 57 Tests New Zealand played, a rate of 1.47 Tests per new player. The huge difference in the rates for the two periods indicates just how stable the New Zealand set-up has been. That has led to a significant improvement in results.
New Zealand have been able to stick with a small pool of players because those players have consistently delivered excellent results in this period. Williamson has led the way with the bat, averaging 64.27 in 55 Tests, but there have also been four others who have scored 1500-plus runs at 40-plus averages (apart from Watling’s average of 38.80).
Three bowlers have taken 180-plus wickets at averages of under 29. In the earlier period they had only one batter scoring 1500-plus runs at an average of over 40, and no bowler taking 100-plus wickets at under 30. The depth and quality can also be gleaned from the fact that 16 different players have won the Player-of-the-Match awards for New Zealand during this period. With performers like these in the last seven years, it is hardly surprising that the results have improved so spectacularly.


.png)


